
Why a Linux Process Says Killed and How to Diagnose OOM
Determine whether Linux, systemd, a container, or a resource limit killed a process by inspecting OOM logs, cgroups, memory pressure, and peak usage.
When a Linux command exits after printing only Killed, it usually received SIGKILL. The kernel OOM killer is a common source, but a systemd unit, container cgroup, administrator, scheduler, timeout wrapper, or resource policy can send the same signal. Confirm the source before increasing memory or retrying the workload.
Capture the exit status
Run the command through its normal launcher and inspect its result immediately:
command_that_failed
status=$?
printf 'exit=%s\n' "$status"
Exit status 137 commonly represents signal 9 (128 + SIGKILL). It proves the process was killed, not why. For a service:
systemctl status SERVICE --no-pager
systemctl show SERVICE -p Result -p ExecMainCode -p ExecMainStatus -p OOMPolicy
Search kernel OOM evidence
sudo journalctl -k --since "30 minutes ago" | grep -Ei 'out of memory|oom-kill|killed process'
sudo dmesg -T | grep -Ei 'out of memory|oom-kill|killed process'
Kernel messages can identify the triggering allocation, selected victim, PID, memory cgroup, and memory state. Preserve the full event rather than copying only the Killed process line.
If kernel logs contain no matching event, check the service manager, container runtime, batch scheduler, audit logs, and any timeout command used to launch the process.
Check cgroup and service limits
A host can have free memory while one cgroup reaches its own limit:
systemctl show SERVICE -p MemoryCurrent -p MemoryPeak -p MemoryMax -p MemoryHigh -p MemorySwapMax
cat /proc/PROCESS_PID/cgroup
On cgroup v2, inspect the affected cgroup’s events and limits through its resolved path:
cat /sys/fs/cgroup/PATH/memory.events
cat /sys/fs/cgroup/PATH/memory.max
cat /sys/fs/cgroup/PATH/memory.current
An increasing oom_kill counter is strong evidence of a cgroup-local OOM event.
Measure system memory pressure
free -h
vmstat 1 10
cat /proc/pressure/memory
swapon --show
Current free memory may look normal after the largest process was killed. Correlate historical monitoring, MemoryPeak, application metrics, and workload timing to reconstruct peak demand.
Look for swap exhaustion, sustained reclaim, high memory pressure stall information, and multiple processes competing at the same time.
Identify memory growth
Before reproducing in production, inspect normal usage:
ps -eo pid,ppid,user,rss,vsz,comm --sort=-rss | head -20
For a controlled test, monitor the process and its children. Account for anonymous memory, page cache, shared memory, memory-mapped files, and child processes rather than relying on one RSS value alone.
Steady growth under stable input suggests a leak. A sharp, repeatable peak may require streaming, batching, lower concurrency, or an explicitly larger limit.
Review overcommit and allocation policy
sysctl vm.overcommit_memory vm.overcommit_ratio
ulimit -a
Shell and service limits can reject or constrain allocations independently of physical capacity. Changing overcommit or adding swap affects the entire host and can replace a clean failure with severe latency, so treat those as capacity decisions rather than quick fixes.
Diagnose it with Rumus
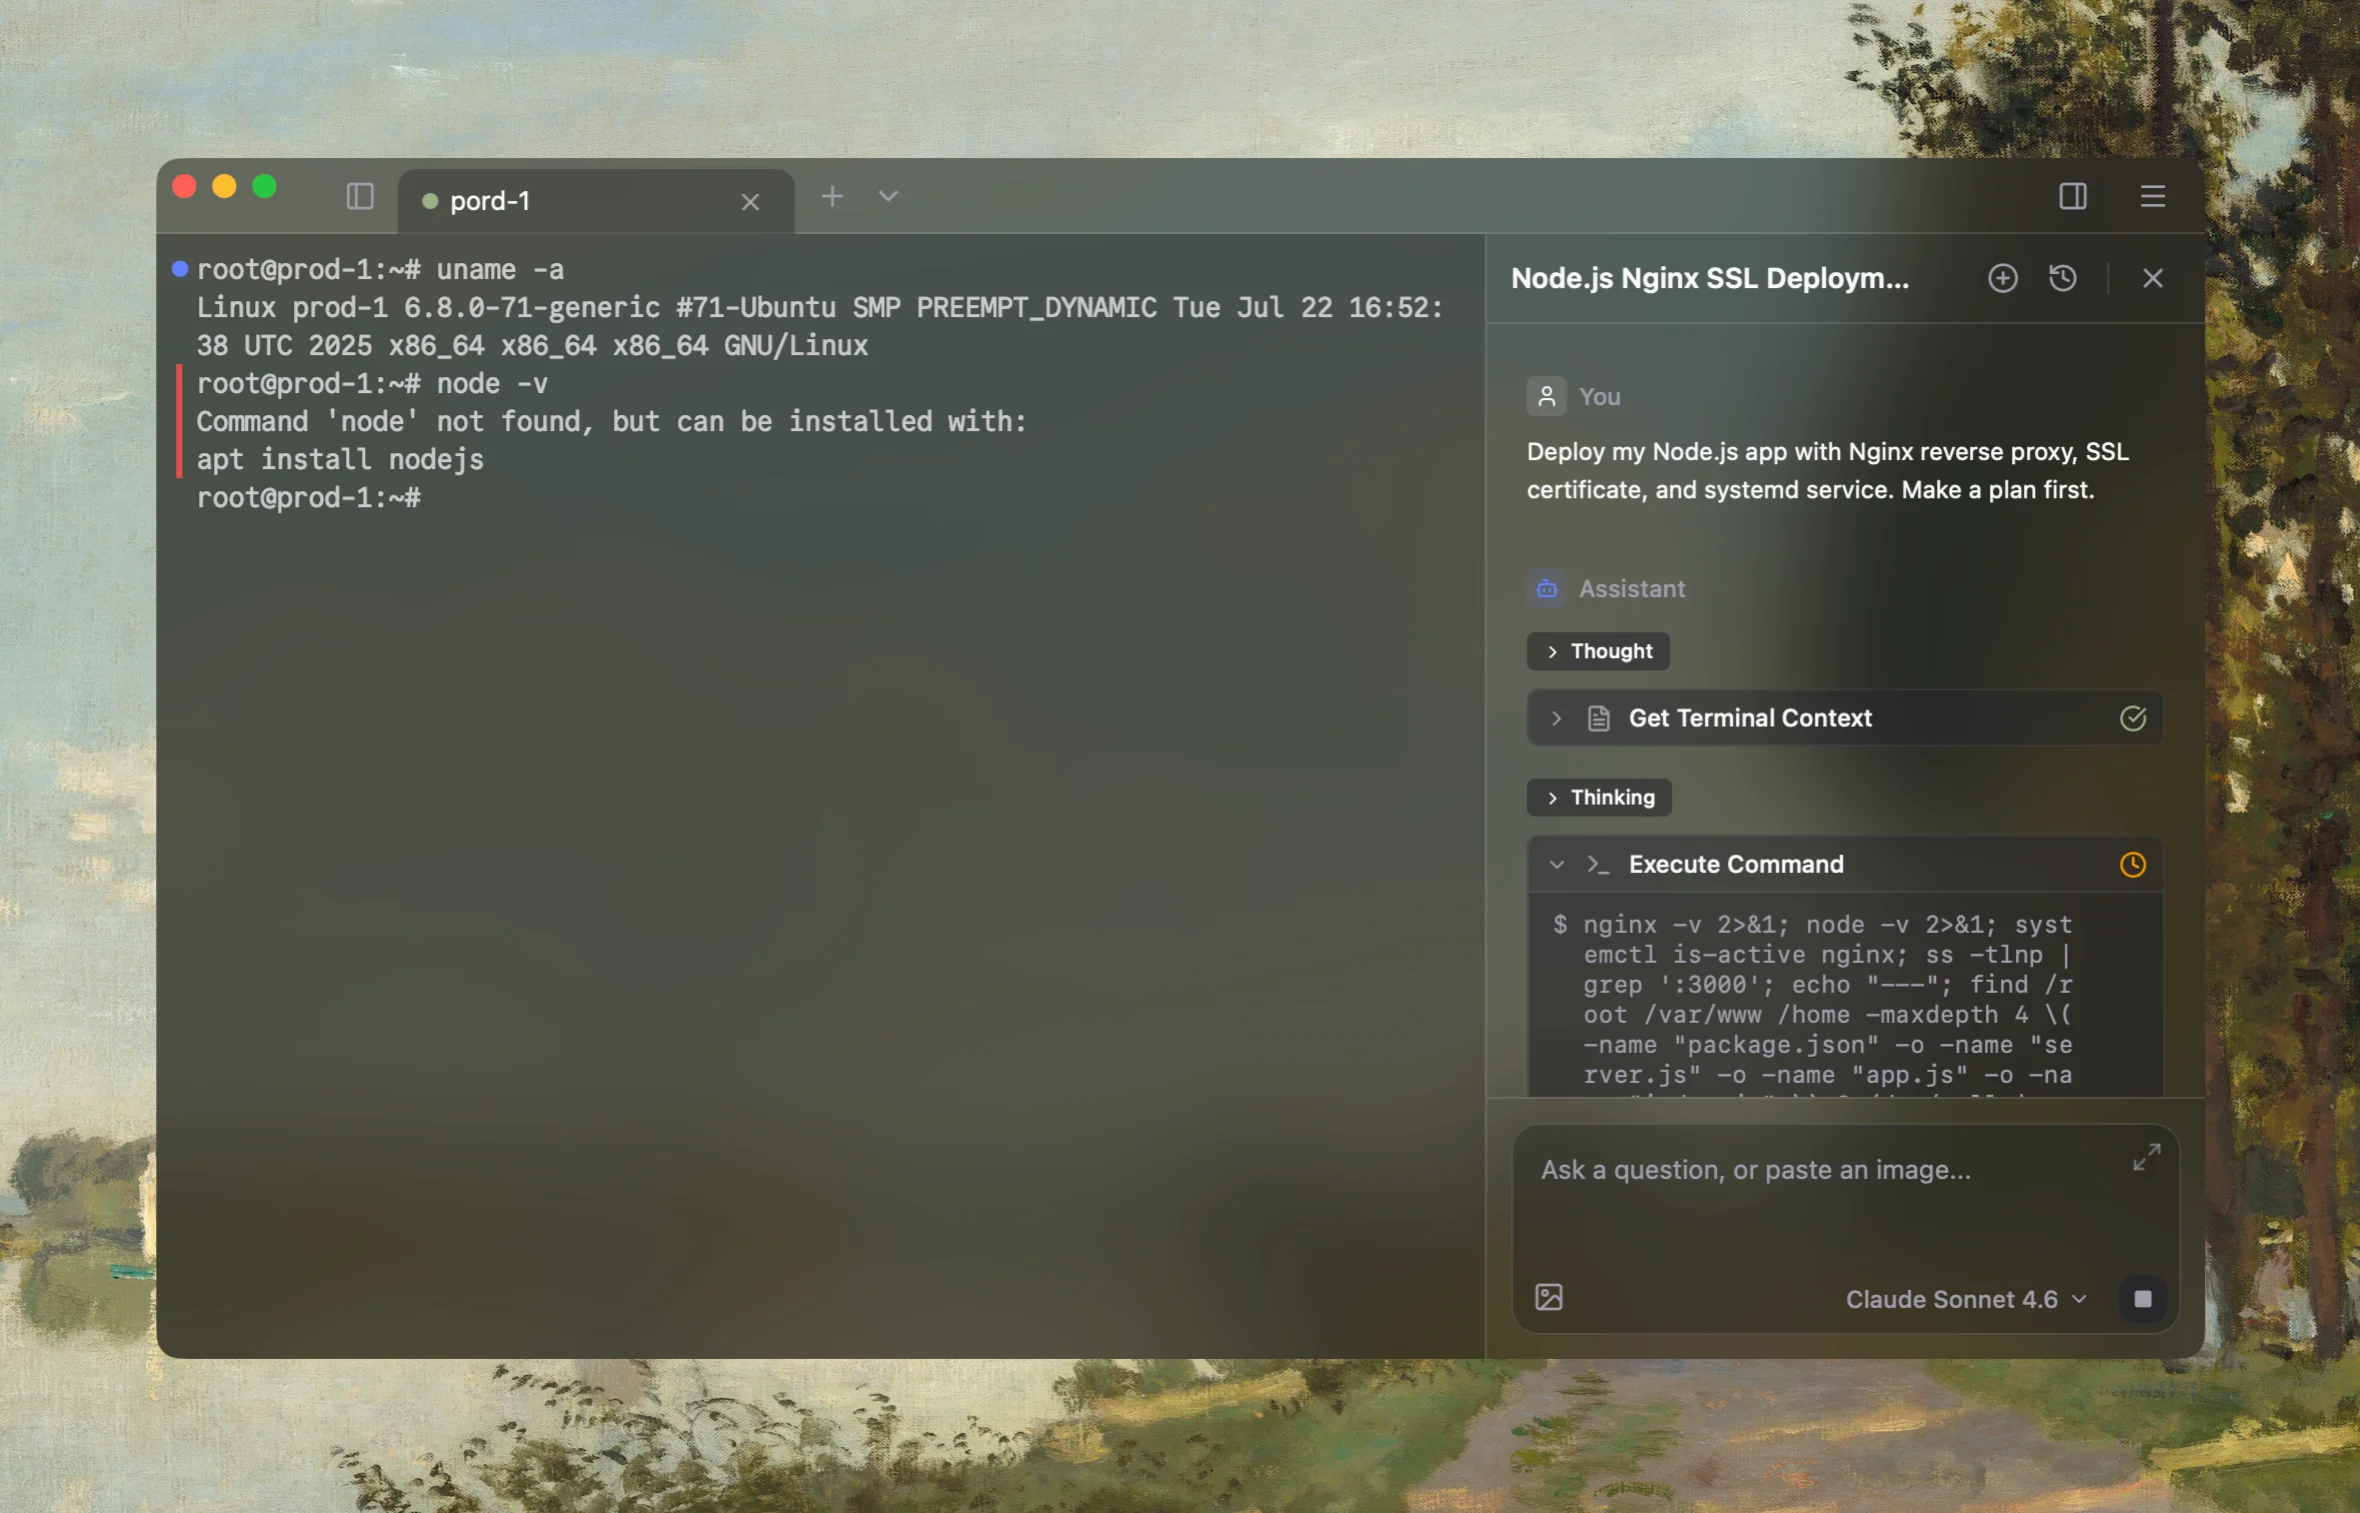
Rumus is an AI-native terminal that can investigate the actual Linux host. Its agent reads relevant files, services, logs, processes, and system state, then proposes a reviewable plan before making changes.
What Rumus can inspect
- Services, processes, sockets, and system resources
- Logs, configuration files, permissions, and ownership
- Read-only evidence before cleanup or restarts
Diagnose why this Linux process printed Killed. Capture its exit status and launcher;
correlate kernel OOM messages, systemd result and OOM policy, container or cgroup
memory.events and limits, host memory and swap, pressure stall information, peak
usage, child processes, concurrent workloads, overcommit, and user limits. Start
read-only and do not restart the workload, raise limits, add swap, change OOM scores,
or modify overcommit policy without approval.
Confirm the fix
After applying the approved code, batching, concurrency, limit, or capacity change, repeat the workload under representative input while monitoring peak memory:
sudo journalctl -k --since "15 minutes ago" | grep -Ei 'out of memory|oom-kill|killed process'
systemctl show SERVICE -p MemoryCurrent -p MemoryPeak -p MemoryMax
Confirm the job completes, peak usage retains safe headroom, oom_kill counters do not increase, and other services remain healthy under concurrent load.
Open the server in Rumus and let the AI agent inspect context, propose a plan, and ask before it runs changes.