
How to Diagnose High Memory Usage on Linux
Understand Linux memory accounting, find the processes and cgroups consuming RAM, and distinguish healthy cache from leaks or memory pressure.
Linux intentionally uses otherwise idle RAM for filesystem cache, so a small free value does not automatically mean the server is out of memory. Diagnose memory pressure using available memory, swap activity, reclaim behavior, process working sets, cgroups, and kernel events.
Read the system-level memory state
free -h
grep -E 'MemTotal|MemFree|MemAvailable|Buffers|Cached|SwapTotal|SwapFree|SReclaimable|Shmem' /proc/meminfo
Focus first on MemAvailable, which estimates how much memory can be used without swapping. Cache can normally be reclaimed; shared memory and unreclaimable kernel allocations behave differently.
Do not clear filesystem caches as a routine fix. It removes useful cached data, can temporarily increase I/O latency, and does not correct an application leak.
Check whether the host is under pressure
vmstat 1 10
cat /proc/pressure/memory
In vmstat, sustained non-zero si and so indicate swap-in and swap-out activity. Memory pressure stall information shows whether workloads are spending time waiting for memory reclaim.
Check recent kernel messages for allocation failures or OOM kills:
sudo journalctl -k --since '24 hours ago' | grep -Ei 'out of memory|oom|killed process'
Find the largest processes
ps -eo pid,ppid,user,rss,vsz,%mem,etime,comm,args --sort=-rss | head -20
RSS includes resident pages but can double-count shared memory across processes. For a closer look at proportional memory, use smem when it is already available:
sudo smem -tk
Avoid installing diagnostic packages on a constrained production server until you confirm there is enough disk and memory capacity.
Inspect a suspicious process
cat /proc/PID/status
cat /proc/PID/smaps_rollup
Compare RssAnon, RssFile, RssShmem, and swap usage. Track the process over time; one snapshot cannot distinguish a stable cache from continuous growth.
Map the process to its service or container:
cat /proc/PID/cgroup
systemctl status SERVICE --no-pager
For cgroup v2 workloads, inspect the relevant memory.current, memory.max, memory.events, and memory.stat files rather than relying only on host-wide numbers.
Check containers and temporary filesystems
docker stats --no-stream
df -h -t tmpfs
Container memory accounting can include page cache, and files stored in tmpfs consume RAM. Kubernetes or Docker limits may cause a container OOM even when the host still has available memory.
Diagnose it with Rumus
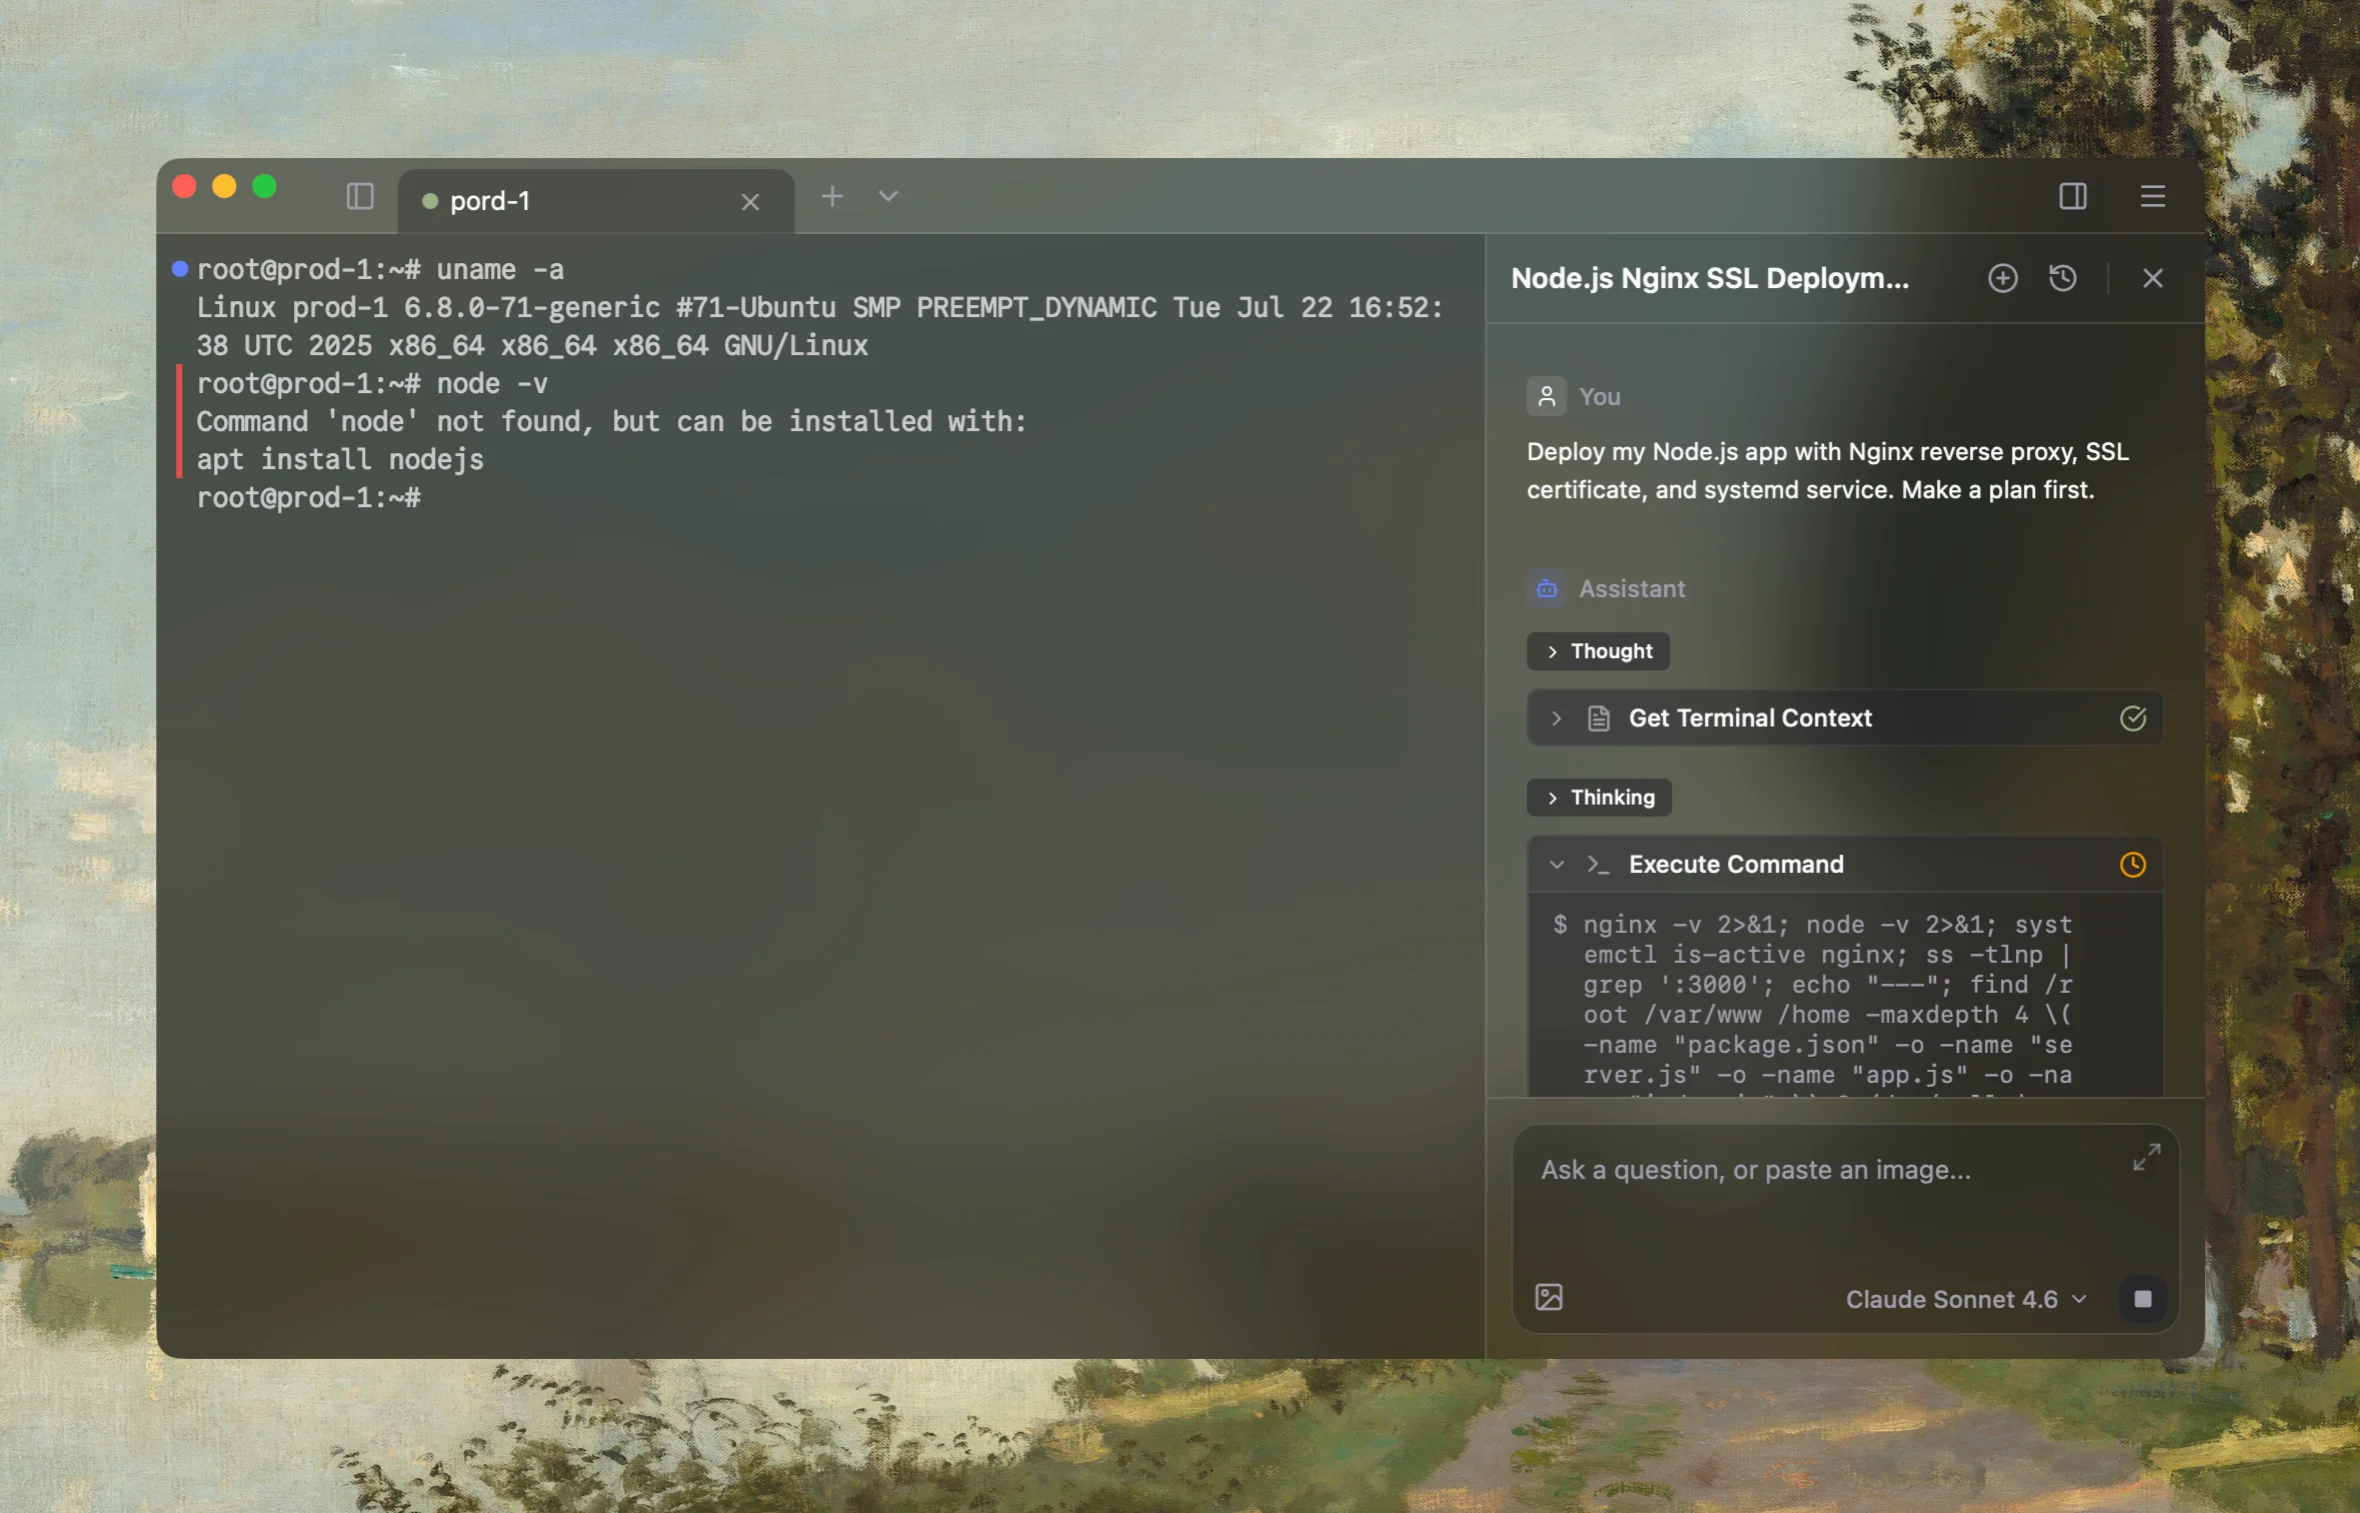
Rumus is an AI-native terminal that can investigate the actual Linux host. Its agent reads relevant files, services, logs, processes, and system state, then proposes a reviewable plan before making changes.
What Rumus can inspect
- Services, processes, sockets, and system resources
- Logs, configuration files, permissions, and ownership
- Read-only evidence before cleanup or restarts
Diagnose this Linux host's high memory usage. Explain MemAvailable, cache, swap,
pressure stalls, and recent OOM events; rank processes and cgroups by meaningful
memory use; inspect suspicious anonymous, file-backed, shared, and tmpfs memory;
and correlate growth with services or containers. Start read-only. Do not drop
caches, kill processes, restart services, or change limits without approval.
Confirm the fix
After correcting the application, workload, or memory limit, monitor through a representative peak period:
watch -n 5 free -h
vmstat 5 60
Confirm that available memory stabilizes, swap churn and pressure fall, OOM events stop, and application latency remains healthy. A lower memory number alone is not proof of a successful fix.
Open the server in Rumus and let the AI agent inspect context, propose a plan, and ask before it runs changes.