
How to Diagnose High Load Average on Linux
Interpret Linux load average correctly and find whether CPU demand, blocked I/O, memory pressure, or uninterruptible tasks are causing it.
Linux load average counts tasks that are runnable or waiting in uninterruptible sleep. A high value can mean CPU contention, but it can also come from blocked disk or network storage, memory reclaim, or stuck kernel operations. Compare load with CPU count and task state before deciding what to fix.
Read the load and CPU count
uptime
nproc
The three load values cover approximately 1, 5, and 15 minutes. A load of 4 has a different meaning on a 2-CPU host than on a 32-CPU host. The trend matters too: a high 1-minute value with lower 5- and 15-minute values may be a recent spike.
Separate CPU demand from blocked tasks
vmstat 1 10
Pay attention to:
r: tasks ready to run on CPUb: tasks blocked in uninterruptible sleepusandsy: user and kernel CPU timewa: CPU time reported as waiting for I/Ost: CPU time taken by the hypervisor
A consistently large run queue with busy CPUs suggests CPU contention. A large blocked-task count with idle CPU suggests storage, filesystem, or another kernel wait.
Find runnable and blocked processes
ps -eo state,pid,ppid,user,wchan:32,%cpu,%mem,etime,comm,args \
  --sort=-%cpu | head -30
Processes in R are runnable. Processes in D are in uninterruptible sleep and often waiting on I/O. The wchan column can hint at the kernel wait point, but interpret it alongside logs and storage evidence.
List only blocked tasks:
ps -eo state,pid,ppid,wchan:32,comm,args | awk '$1 ~ /^D/'
Do not assume a D state process can be fixed with kill -9; signals are handled only after the kernel operation returns.
Check CPU and I/O pressure
cat /proc/pressure/cpu
cat /proc/pressure/io
cat /proc/pressure/memory
Pressure Stall Information shows how much time workloads lose because CPU, I/O, or memory is unavailable. It can reveal impact that a single utilization percentage misses.
If iostat is already installed, inspect device latency and queueing:
iostat -xz 1 10
High latency may originate below the guest, on network storage, or in a cloud volume limit. Avoid installing packages on an already distressed server unless you have confirmed adequate capacity.
Correlate logs and workload changes
sudo journalctl --since '30 minutes ago' --priority warning --no-pager
systemctl --failed
Look for storage resets, filesystem errors, OOM events, network filesystem timeouts, retry loops, scheduled jobs, traffic spikes, or a deployment at the same time the load increased.
Diagnose it with Rumus
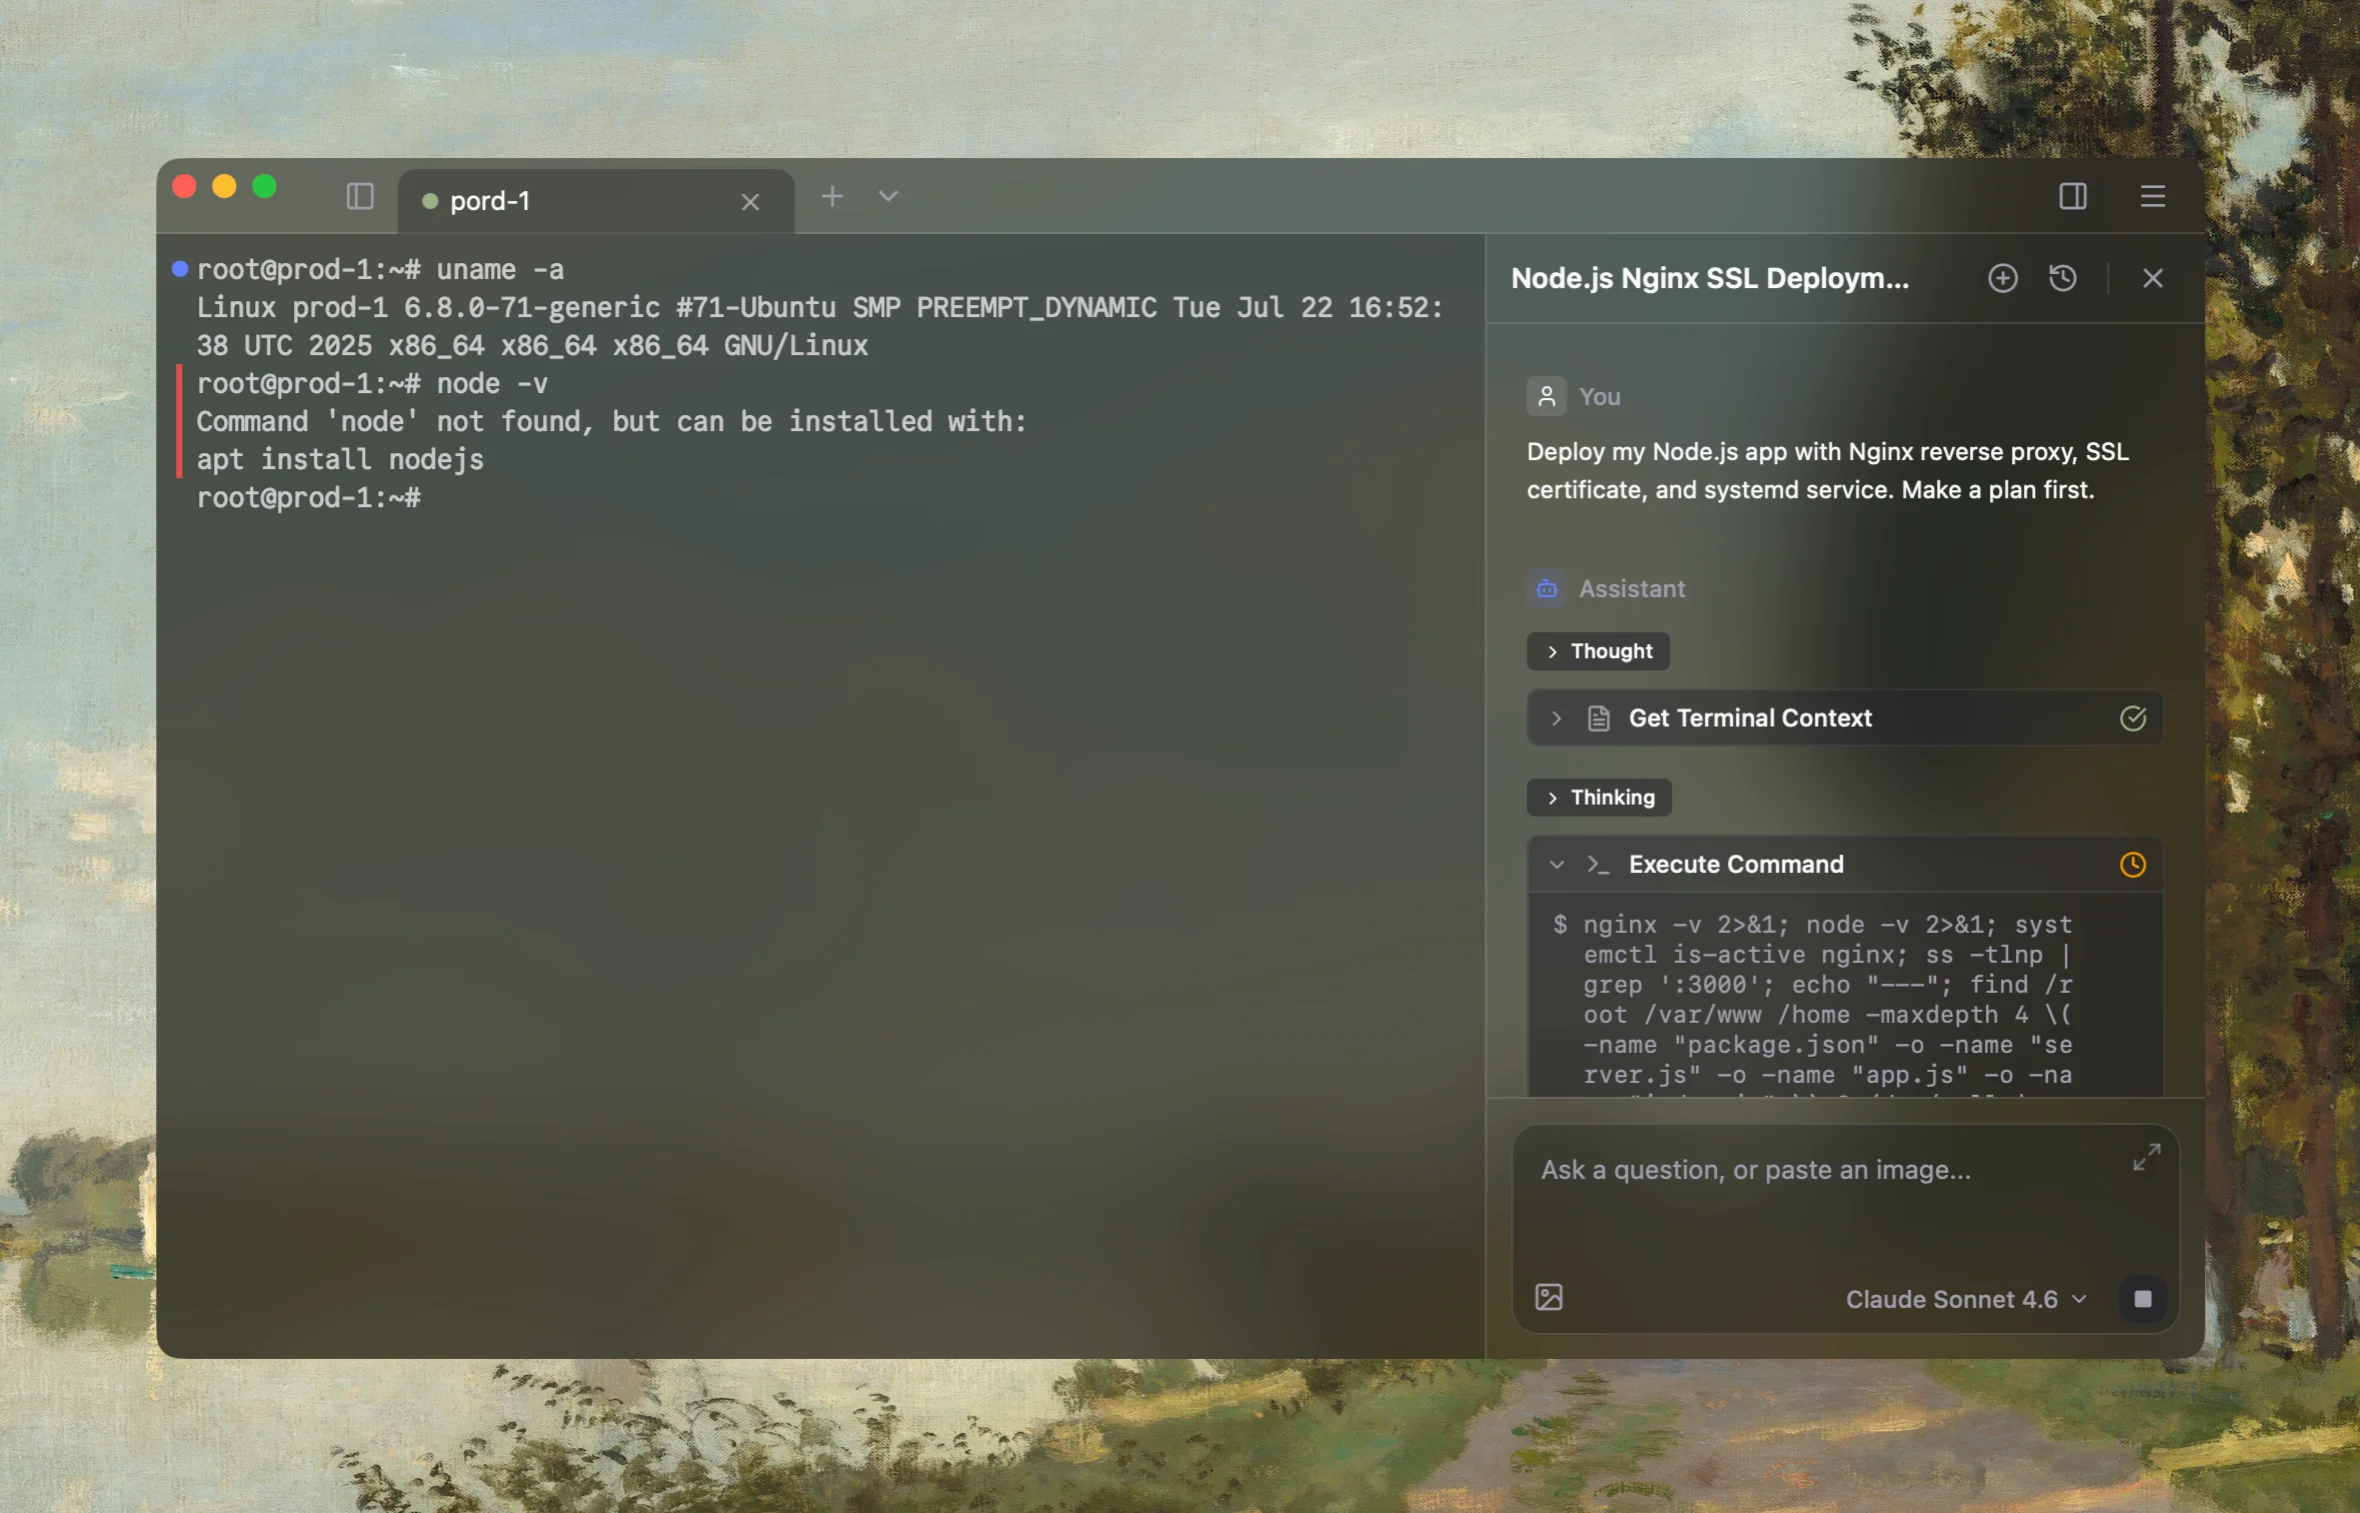
Rumus is an AI-native terminal that can investigate the actual Linux host. Its agent reads relevant files, services, logs, processes, and system state, then proposes a reviewable plan before making changes.
What Rumus can inspect
- Services, processes, sockets, and system resources
- Logs, configuration files, permissions, and ownership
- Read-only evidence before cleanup or restarts
Diagnose this Linux host's high load average. Compare the 1, 5, and 15 minute
load with CPU count; inspect runnable and uninterruptible tasks, CPU and PSI
pressure, I/O latency, memory reclaim, steal time, logs, scheduled jobs, and
recent deployments. Explain whether the load is CPU or wait driven. Start
read-only and do not kill processes or restart services without approval.
Confirm the fix
Repeat the same observations through a representative interval:
uptime
vmstat 5 60
Confirm that queueing and pressure fall, blocked tasks clear, and application latency and error rates recover. A falling load average alone does not prove that the underlying service is healthy.
Open the server in Rumus and let the AI agent inspect context, propose a plan, and ask before it runs changes.