
How to Diagnose High CPU Usage on Linux
Find the process, thread, workload, or system condition causing high Linux CPU usage and verify the fix without killing the wrong service.
High CPU usage is not automatically a fault: a busy server may be doing useful work. Diagnose whether the pressure comes from one process, many runnable tasks, kernel activity, virtual-machine steal time, or repeated short-lived processes before taking action.
Establish the system-level pattern
uptime
top
vmstat 1 10
In vmstat, compare user CPU (us), system CPU (sy), idle (id), I/O wait (wa), and steal time (st). A high load average with low CPU usage may indicate blocked I/O rather than CPU saturation.
Find the busiest processes
ps -eo pid,ppid,user,stat,%cpu,%mem,etime,comm,args --sort=-%cpu | head -20
CPU percentages can exceed 100% for multithreaded processes. Record the process owner, parent, elapsed time, and complete command before deciding whether it is expected.
Inspect hot threads
For a multithreaded process:
top -H -p PID
ps -L -p PID -o pid,tid,psr,stat,%cpu,comm --sort=-%cpu
Application-specific profilers provide better evidence than immediately attaching a generic debugger in production. Check whether the service already exposes profiles, traces, or runtime metrics.
Check service logs and recent changes
systemctl status SERVICE --no-pager
journalctl -u SERVICE --since '30 minutes ago' --no-pager
Look for retry loops, traffic spikes, failing dependencies, runaway scheduled tasks, or a deployment that coincides with the increase. Do not use kill -9 as the first response; it prevents graceful shutdown and destroys useful state.
Diagnose it with Rumus
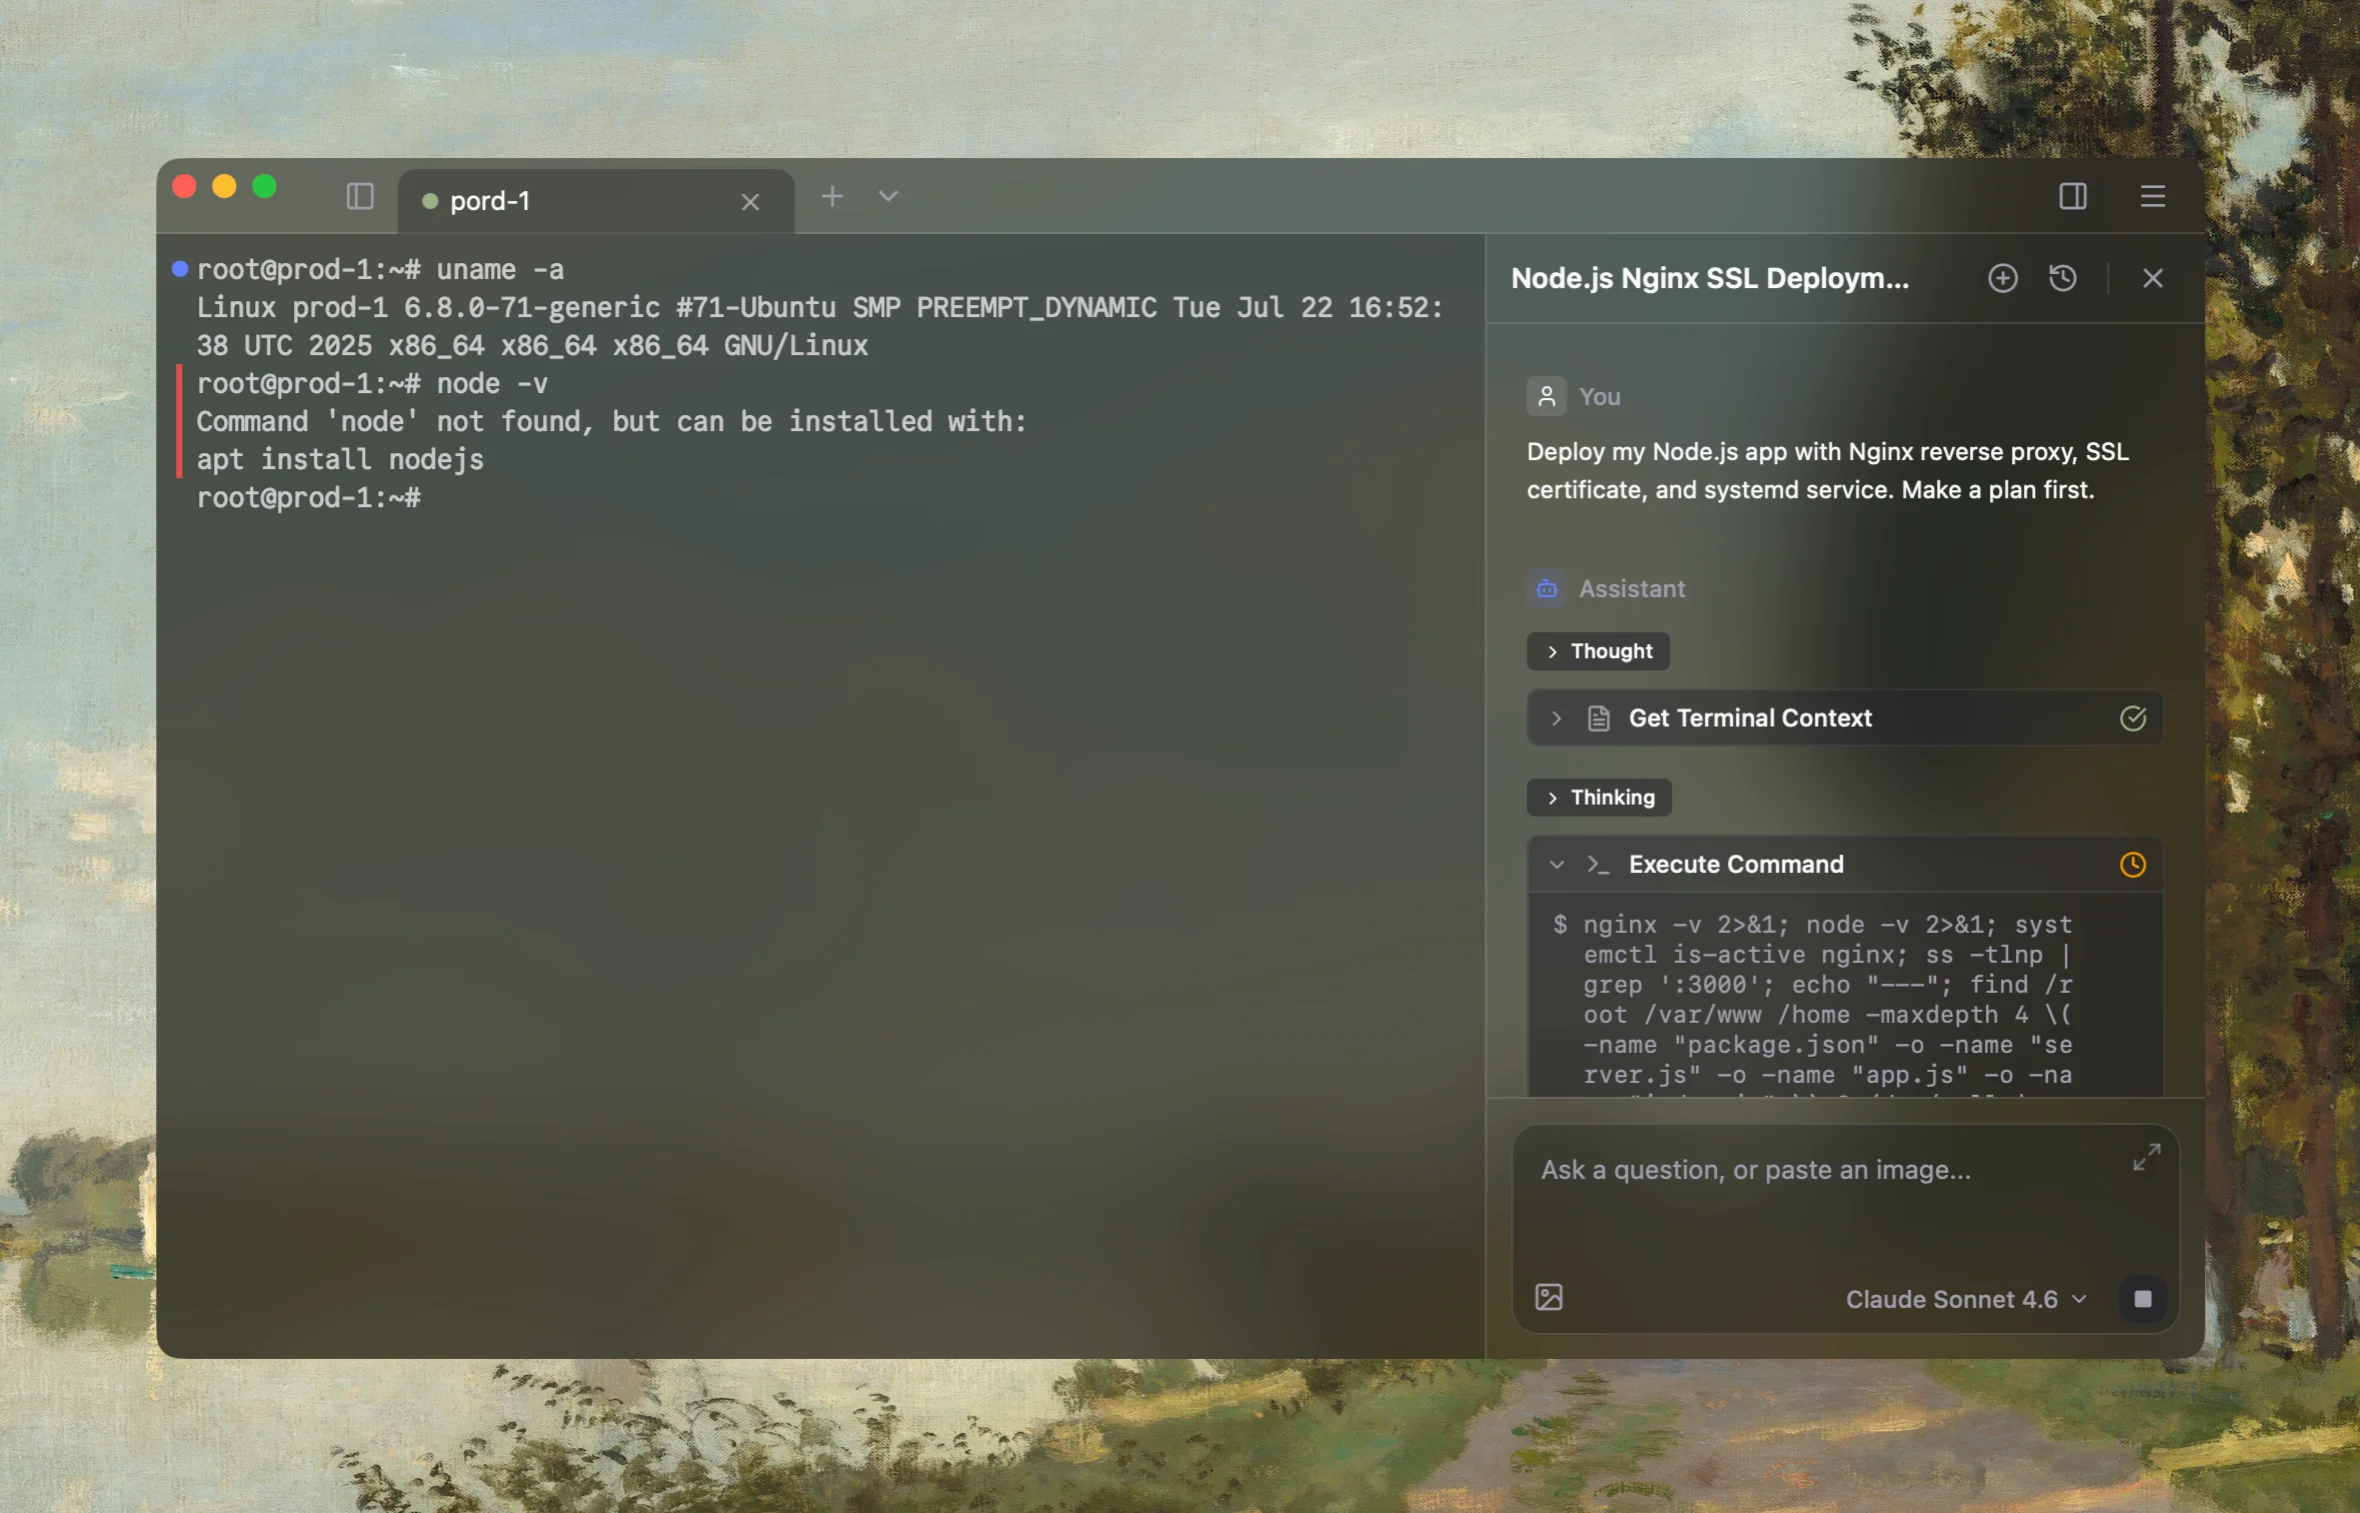
Rumus is an AI-native terminal that can investigate the actual Linux host. Its agent reads relevant files, services, logs, processes, and system state, then proposes a reviewable plan before making changes.
What Rumus can inspect
- Services, processes, sockets, and system resources
- Logs, configuration files, permissions, and ownership
- Read-only evidence before cleanup or restarts
Diagnose this Linux host's high CPU usage. Establish CPU, load, run-queue, I/O
wait, and steal-time patterns; identify the busiest processes and threads; map
them to services or containers; and correlate logs and recent changes. Start
read-only and do not terminate, restart, or renice processes without approval.
Confirm the fix
After correcting the workload or configuration, repeat the same measurements over a representative interval:
vmstat 1 30
ps -eo pid,%cpu,%mem,etime,comm --sort=-%cpu | head
Verify application latency and error rate as well as CPU. Lower CPU is not a successful fix if requests are now failing or queued elsewhere.
Open the server in Rumus and let the AI agent inspect context, propose a plan, and ask before it runs changes.