
How to Debug Kubernetes Readiness Probe Failures
Diagnose Kubernetes readiness probe failures by checking events, probe configuration, application listeners, dependencies, timing, and resource pressure.
A failed readiness probe removes a pod from matching Service endpoints without necessarily restarting it. This protects users from traffic to an application that is not ready, but a broken probe can also keep a healthy application unavailable. Diagnose whether the probe, application, dependency, or available resources are responsible before relaxing it.
Read the exact probe failure
Inspect pod status and recent events:
kubectl get pod POD -n NAMESPACE -o wide
kubectl describe pod POD -n NAMESPACE
kubectl get events -n NAMESPACE --sort-by=.lastTimestamp
Common messages include:
connection refused: nothing accepted the connection at that address and portcontext deadline exceeded: the probe did not finish before its timeout- HTTP status such as
500or503: the application answered but reported failure no such file or directory: an exec probe command or binary is missing
Preserve the event text because it often contains the exact path, port, and failure mode.
Inspect the effective probe configuration
kubectl get pod POD -n NAMESPACE -o yaml
kubectl get deployment DEPLOYMENT -n NAMESPACE -o yaml
Review:
- probe type: HTTP, TCP, gRPC, or exec
- port name or number
- HTTP path, scheme, and headers
initialDelaySecondsandperiodSecondstimeoutSeconds,successThreshold, andfailureThreshold
A named probe port must match a named container port. The kubelet probes the pod IP, so an application listening only on 127.0.0.1 will refuse HTTP and TCP probes.
Compare the probe with the application listener
Check logs and the container’s listening sockets:
kubectl logs POD -n NAMESPACE -c CONTAINER --tail=200
kubectl exec POD -n NAMESPACE -c CONTAINER -- sh -c 'cat /proc/net/tcp /proc/net/tcp6'
If approved tools exist in the image, call the readiness endpoint locally:
kubectl exec POD -n NAMESPACE -c CONTAINER -- \
  sh -c 'wget -S -O- http://127.0.0.1:PORT/PATH'
Local success does not prove the kubelet can reach the pod IP. Confirm the application binds to the pod interface and the configured probe port matches the listener.
Check application startup and dependencies
Readiness often depends on database migrations, caches, credentials, downstream APIs, or internal queues. Correlate probe failures with application logs:
kubectl logs POD -n NAMESPACE -c CONTAINER --since=15m --timestamps
kubectl logs POD -n NAMESPACE -c CONTAINER --previous --tail=200
If a slow startup is expected, use a startupProbe to protect startup rather than setting readiness thresholds so high that real outages remain hidden. Consider whether every downstream dependency truly needs to make the pod unready; a fragile readiness endpoint can amplify an unrelated outage.
Inspect resource pressure
kubectl top pod POD -n NAMESPACE --containers
kubectl describe pod POD -n NAMESPACE
CPU throttling, memory pressure, long garbage-collection pauses, and overloaded worker pools can make an otherwise correct endpoint exceed timeoutSeconds. Compare requested and limited resources with actual demand and node conditions.
Avoid increasing probe timeouts until you measure typical and worst-case endpoint latency. A timeout change can conceal application saturation.
Verify Service endpoint impact
kubectl get endpointslice -n NAMESPACE \
  -l kubernetes.io/service-name=SERVICE -o wide
kubectl get pods -n NAMESPACE -l 'APP_SELECTOR' \
  -o custom-columns=NAME:.metadata.name,READY:.status.conditions[?\(@.type==\"Ready\"\)].status
Confirm how many replicas remain ready. If every replica fails simultaneously, compare rollout changes, shared dependencies, configuration, and node placement before restarting pods.
Diagnose it with Rumus
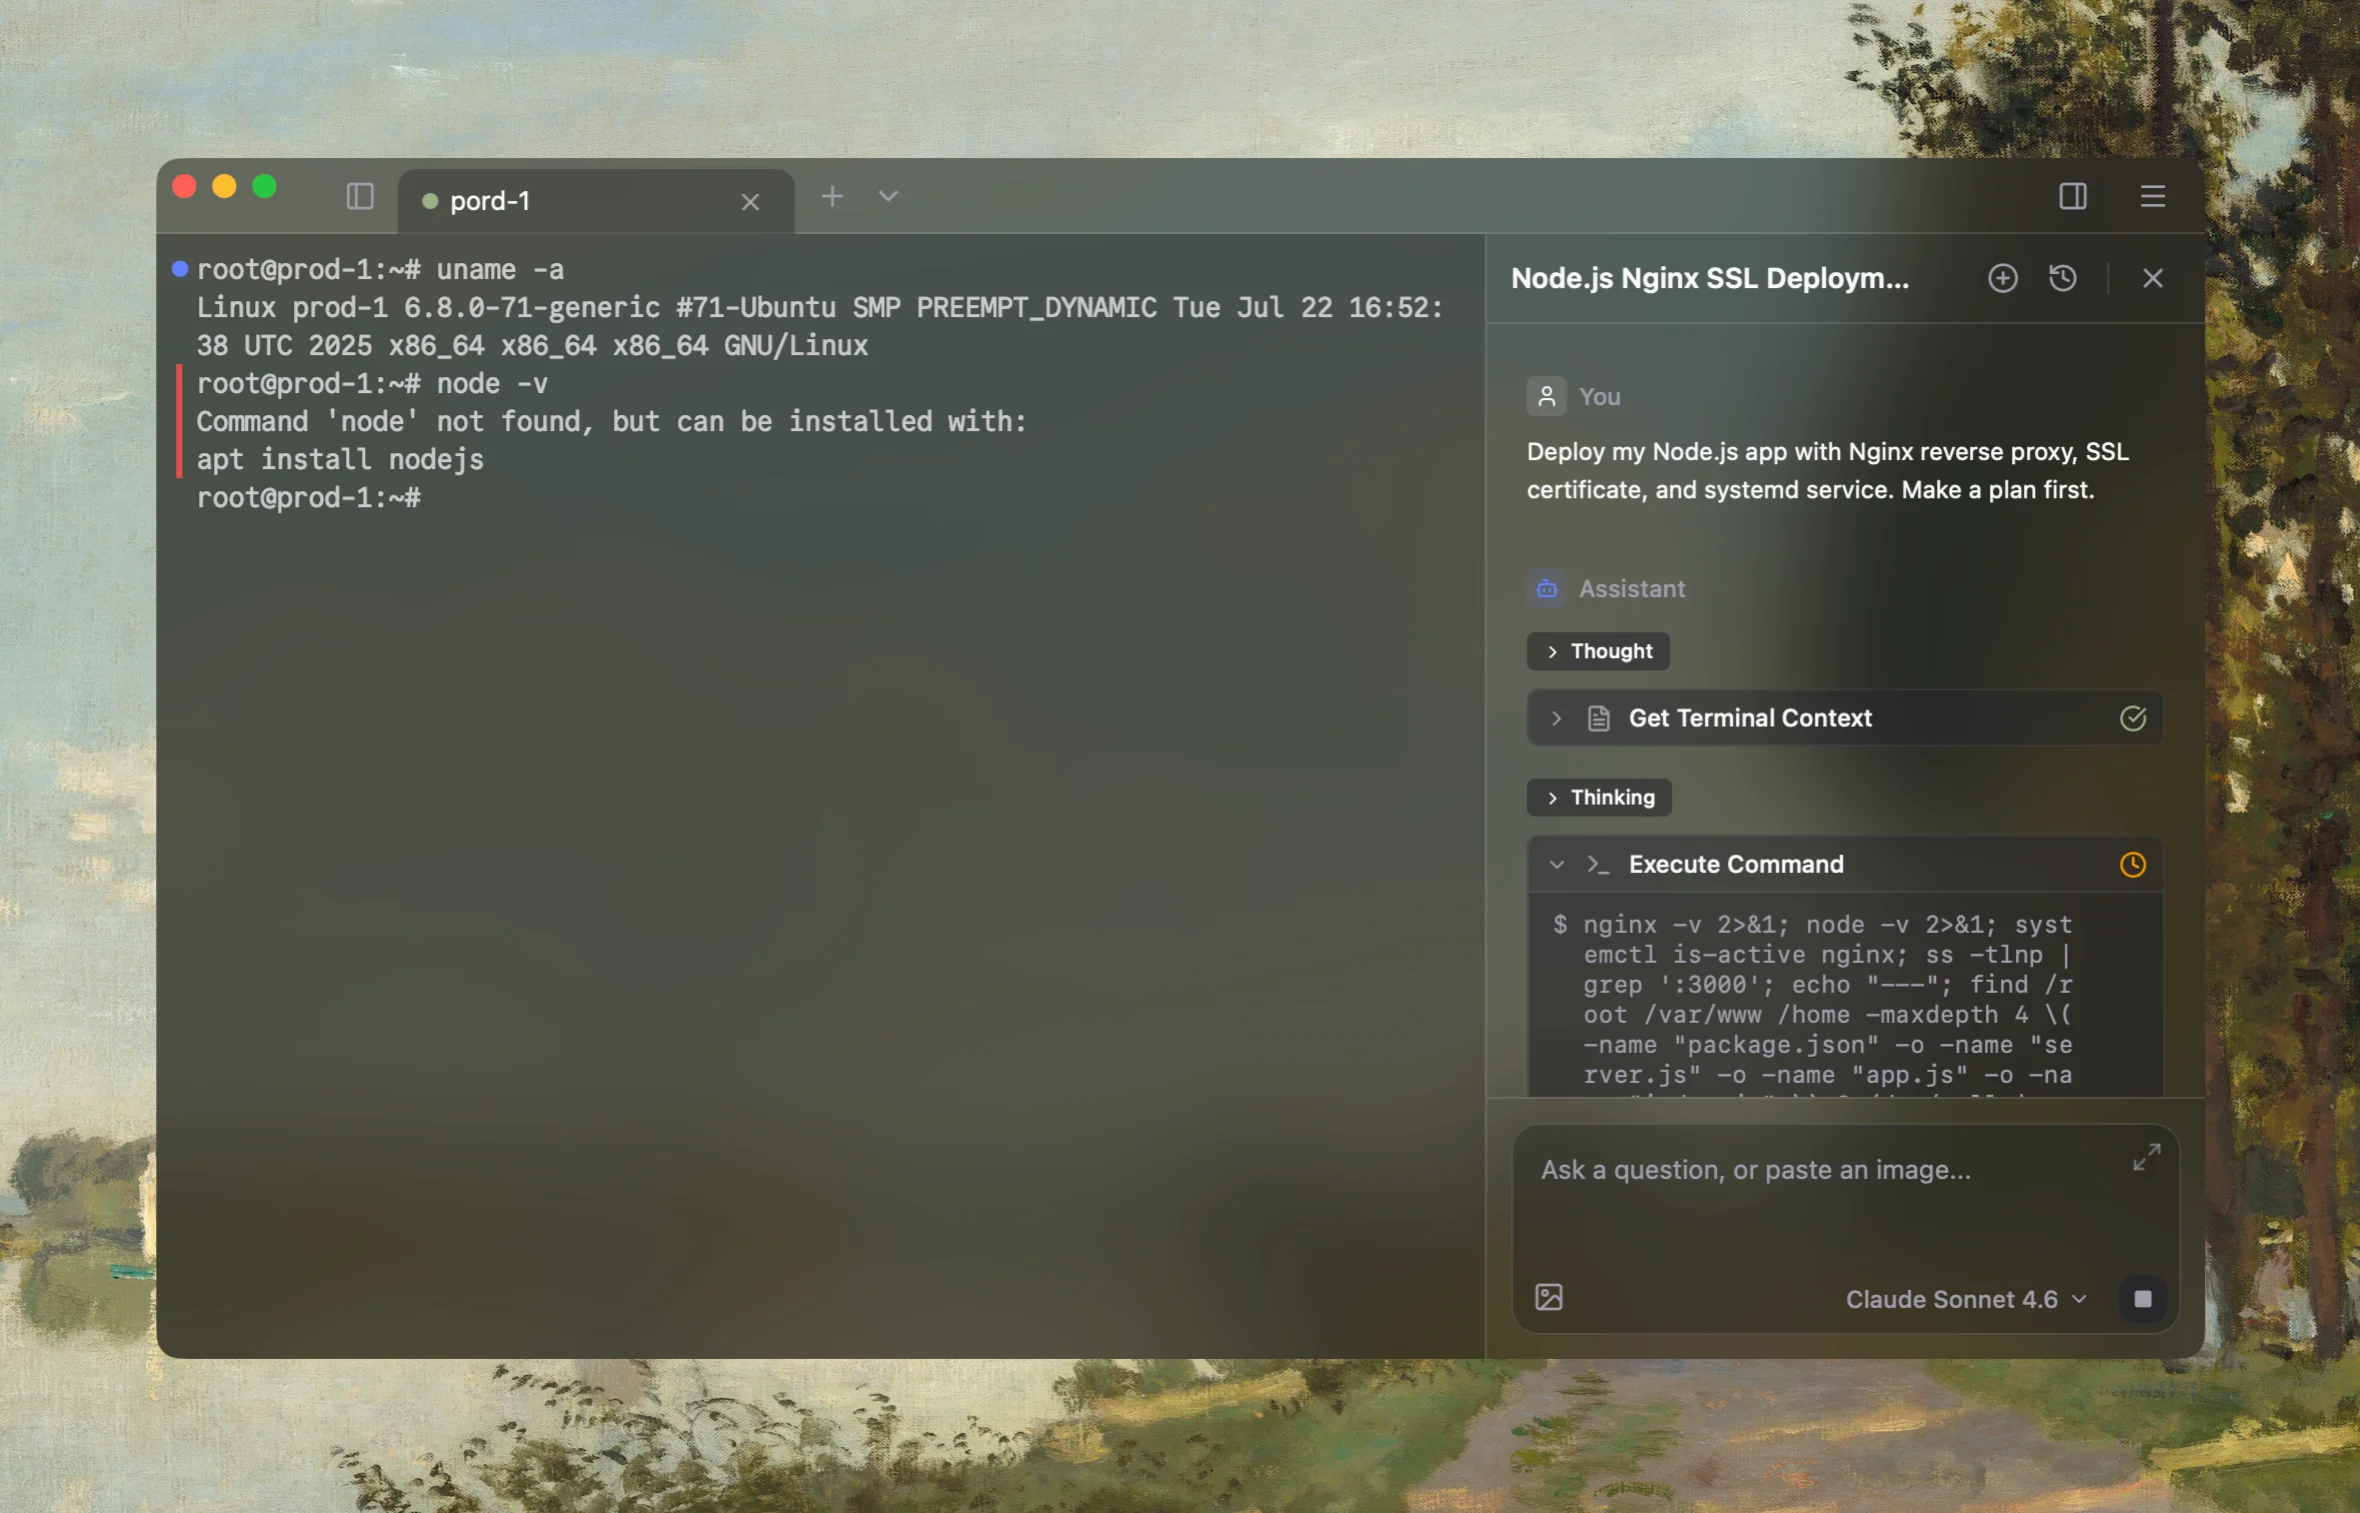
Rumus is an AI-native terminal that can use your current Kubernetes context to correlate pods, events, logs, controllers, resources, and nodes. It keeps the investigation read-only until you approve a proposed change.
What Rumus can inspect
- Pods, events, previous logs, and owning controllers
- Resources, probes, scheduling rules, and node state
- Secret-aware output and approval before cluster changes
Diagnose why this Kubernetes readiness probe is failing. Inspect the exact events,
effective probe type, port, path and timing; application logs and listeners,
startup behavior, required dependencies, container resources, node conditions,
and EndpointSlice impact. Start read-only and do not restart pods, alter probes,
or change resource limits without approval.
Confirm the fix
Watch the rollout and readiness condition after the approved fix:
kubectl get pods -n NAMESPACE -w
kubectl rollout status deployment/DEPLOYMENT -n NAMESPACE
kubectl get endpointslice -n NAMESPACE \
  -l kubernetes.io/service-name=SERVICE -o wide
Confirm pods remain ready for several probe intervals, all intended endpoints return to the Service, application traffic succeeds, and logs contain no recurring dependency or latency failures.
Open the server in Rumus and let the AI agent inspect context, propose a plan, and ask before it runs changes.