
How to Debug Kubernetes Liveness Probe Failures
Diagnose Kubernetes liveness probe failures by checking events, restart history, probe configuration, application stalls, dependencies, and resource pressure.
A failed liveness probe tells the kubelet that a container should be restarted. Unlike readiness, which removes a pod from Service endpoints, repeated liveness failures can create a restart loop and erase the live state needed to understand an application stall. First determine whether the application is unhealthy or the probe is incorrectly designed.
Read events and restart history
kubectl describe pod POD -n NAMESPACE
kubectl get pod POD -n NAMESPACE \
  -o custom-columns=NAME:.metadata.name,READY:.status.containerStatuses[*].ready,RESTARTS:.status.containerStatuses[*].restartCount
kubectl get events -n NAMESPACE --sort-by=.lastTimestamp
Record the exact failure:
connection refused: no listener accepted the probecontext deadline exceeded: the probe exceeded its timeout- HTTP
500or another failure status: the application responded unhealthy - exec probe exit code: the command ran and reported failure
Correlate event times with restarts and application logs.
Preserve previous container logs
After a liveness restart:
kubectl logs POD -n NAMESPACE -c CONTAINER --previous --timestamps
kubectl logs POD -n NAMESPACE -c CONTAINER --since=15m --timestamps
Previous logs often contain the only evidence of a deadlock, long garbage collection pause, dependency timeout, or resource exhaustion before the kubelet restarted the process.
If the pod has multiple containers, select the one whose liveness probe failed.
Inspect the effective probe
kubectl get pod POD -n NAMESPACE -o yaml
kubectl get deployment DEPLOYMENT -n NAMESPACE -o yaml
Review the probe type, port, path, scheme, headers, command, and timing:
initialDelaySecondsperiodSecondstimeoutSecondsfailureThresholdsuccessThreshold
For long or variable startup, use a startupProbe instead of weakening liveness for the entire container lifetime.
Test the target without changing state
For HTTP probes, compare the configured path with the application listener and logs. If approved tools exist in the image:
kubectl exec POD -n NAMESPACE -c CONTAINER -- \
  sh -c 'wget -S -O- http://127.0.0.1:PORT/PATH'
The kubelet normally probes the pod IP, not 127.0.0.1. An application bound only to loopback may succeed locally while the kubelet receives connection refused.
For exec probes, run the exact command and print its exit status. Check its runtime cost: a probe that forks expensive processes or scans large data can contribute to the failure.
Check resource pressure and stalls
kubectl top pod POD -n NAMESPACE --containers
kubectl describe pod POD -n NAMESPACE
kubectl describe node NODE
CPU throttling, memory pressure, disk latency, exhausted worker pools, and long garbage collection can make a correct endpoint miss a short timeout. Compare usage with requests and limits, node conditions, and application latency metrics.
Increasing the timeout can be appropriate after measurement, but it should not conceal persistent saturation.
Keep liveness independent where possible
A liveness endpoint should answer whether restarting this process can recover it. If it fails whenever a database or external API is unavailable, every replica may restart during a shared dependency outage, making recovery harder.
Use readiness for conditions that should stop traffic temporarily. Keep liveness focused on unrecoverable local states such as a deadlocked event loop, while considering application-specific behavior.
Diagnose it with Rumus
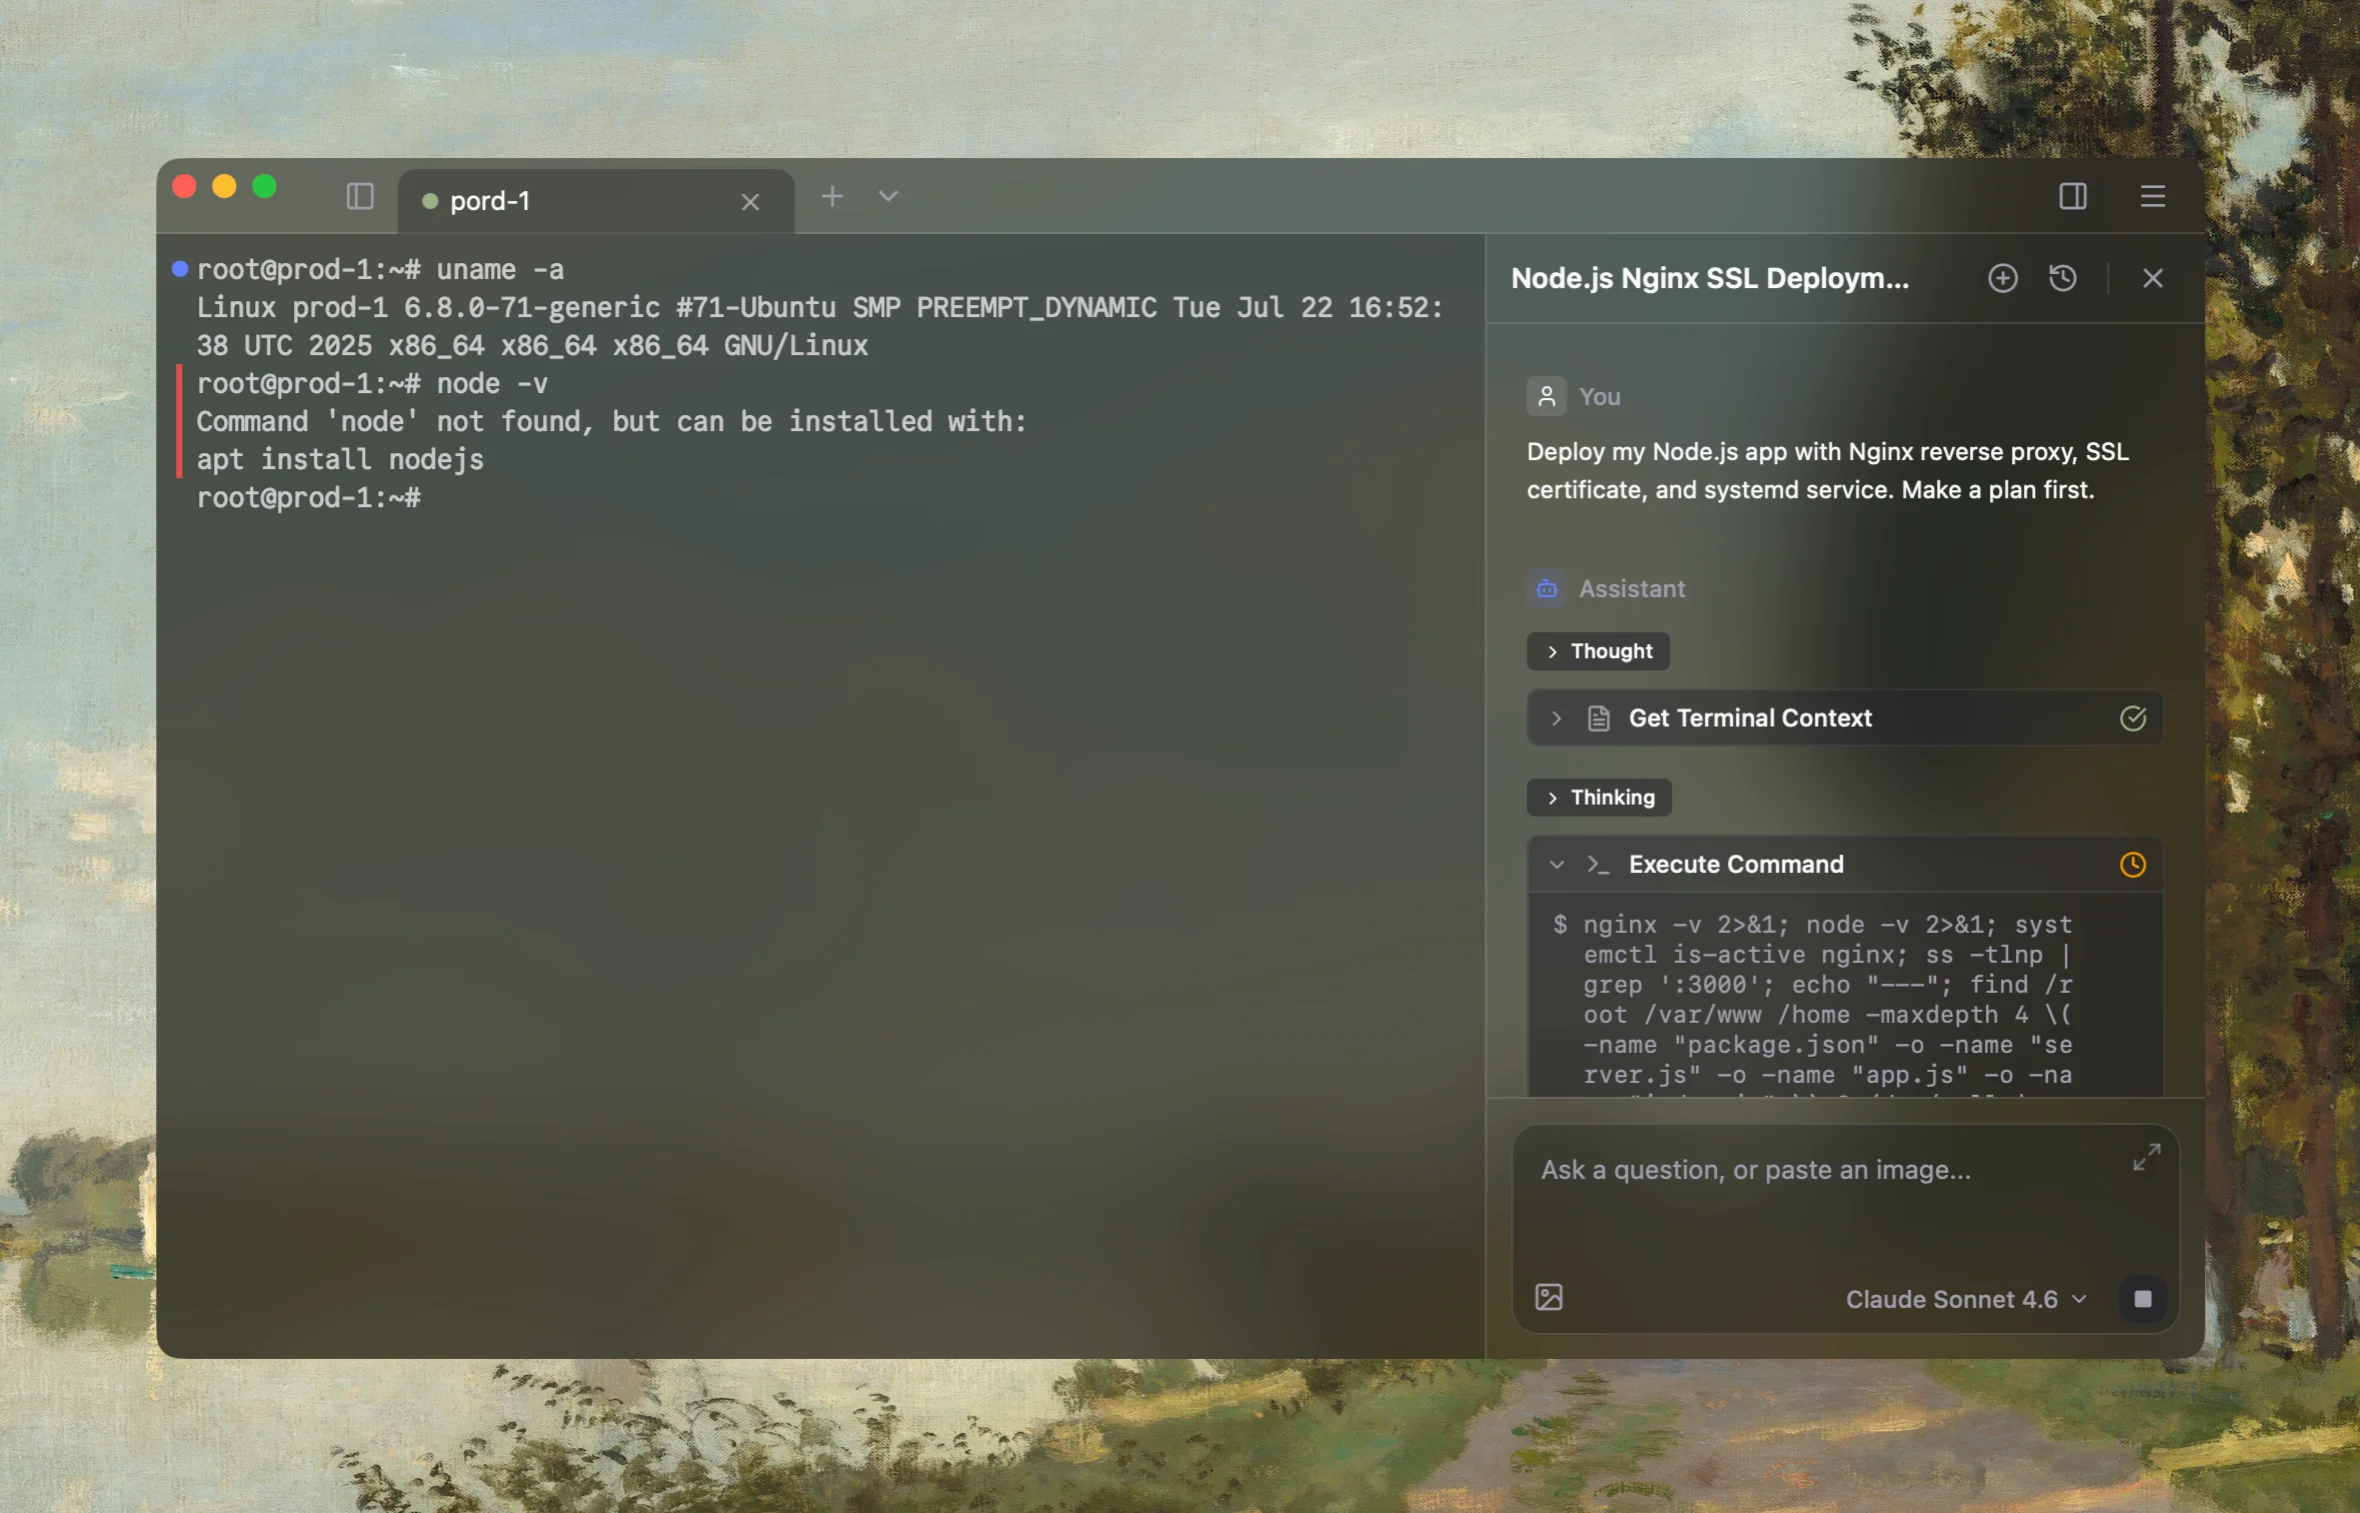
Rumus is an AI-native terminal that can use your current Kubernetes context to correlate pods, events, logs, controllers, resources, and nodes. It keeps the investigation read-only until you approve a proposed change.
What Rumus can inspect
- Pods, events, previous logs, and owning controllers
- Resources, probes, scheduling rules, and node state
- Secret-aware output and approval before cluster changes
Diagnose this Kubernetes liveness probe failure. Preserve exact events, restart
counts and previous logs; inspect the effective probe type, target and timing,
application listeners and latency, startup behavior, local stalls, dependencies,
container resources, throttling and node conditions. Distinguish liveness from
readiness. Start read-only and do not restart pods, disable or relax probes, or
change resources without approval.
Confirm the fix
After applying the approved application, probe, startup, or resource change:
kubectl rollout status deployment/DEPLOYMENT -n NAMESPACE
kubectl get pods -n NAMESPACE -w
kubectl get events -n NAMESPACE --sort-by=.lastTimestamp
Observe the workload for longer than the previous failure interval. Confirm restart counts remain stable, probes continue succeeding during expected load, readiness behaves independently, and the application remains responsive to real traffic.
Open the server in Rumus and let the AI agent inspect context, propose a plan, and ask before it runs changes.